⚠️ This content has been written a long time ago. As such, it might not reflect my current thoughts anymore. I keep this page online because it might still contain valid information.
Elasticsearch, Logstash & Kibana with Docker
— Clermont-Fd Area, France2024-04-08 // I proofread this article and fixed some links.
Yesterday, I gave a talk on how I use Docker to deploy applications at Clermont’ech API Hour #12, a French local developer group. I explained how to create a simple yet robust infrastructure to deploy a web application and a few services with zero downtime.
In order to monitor my infrastructure, and especially the HTTP responses, I gave the popular ELK stack a try. ELK stands for Elasticsearch, Logstash, Kibana. Since I haven’t covered this part in my talk, I am going to describe it here.
The ELK stack
I wrote a Dockerfile to build an ELK image. While you can directly use this image to run a container (mounting a host folder as a volume for the configuration files), you should probably extend it to add your own configuration so that you can get rid of the mapping to a host folder. This is one of the Docker best practices currently.
You will find Elasticsearch’s data in /data. I recommend you to use a
data-only container to
persist the data. The two commands below should get you started:
$ docker run -d -v /data --name dataelk busybox
$ docker run -p 8080:80 \
    -v /path/to/your/logstash/config:/etc/logstash \
    --volumes-from dataelk \
    willdurand/elk
Logstash forwarder
Such a stack should probably run on its own server. The logstash configuration
should only receive logs from the outside (the production environment for
instance) and send them to Elasticsearch. We need a tool to collect the logs in
production and process them somewhere else. Fortunately, that is exactly the
goal of the logstash-forwarder (formerly known as lumberjack) project!
Below is an example of logstash configuration to process logs received on port
5043 thanks to the lumberjack input. You may have noticed that
Hipache logs are filtered (I actually took
this configuration from my production server :p).
input {
  lumberjack {
    port => 5043
    ssl_certificate => "/etc/ssl/logstash-forwarder.crt"
    ssl_key => "/etc/ssl/logstash-forwarder.key"
  }
}

filter {
  if [type] == "hipache" {
    grok {
      patterns_dir => "/etc/logstash/patterns/nginx"
      match => { "message" => "%{NGINXACCESS}" }
    }
  }
}

output {
  elasticsearch {
    host => "127.0.0.1"
    cluster => "logstash"
    # Uncomment the line below if you use Kibana 3.1.0
    # embedded => false
  }
}
It is worth mentioning that logstash-forwarder requires
SSL.
Back to the production environment, I wrote a Dockerfile to run
logstash-forwarder.
You need the same set of SSL files as seen previously in the logstash
configuration, and a configuration file for logstash-forwarder. Then again,
using this image as a base image is recommended but, for testing purposes, we
can mount host folders as volumes:
$ docker run \
    --volume /path/to/your/ssl/files:/etc/ssl \
    --volume /path/to/your/config/file:/etc/logstash-forwarder \
    --volume /var/log/nginx:/var/log/nginx \
    willdurand/logstash-forwarder
The logstash-forwarder config.json file contains the following content. It
tells logstash-forwarder to send hipache logs (found in
/var/log/hipache/access.log) to logstash.example.org:5043:
{
  "network": {
    "servers": [ "logstash.example.org:5043" ],
    "ssl certificate": "/etc/ssl/logstash-forwarder.crt",
    "ssl key": "/etc/ssl/logstash-forwarder.key",
    "ssl ca": "/etc/ssl/logstash-forwarder.crt"
  },
  "files": [
    {
      "paths":  [ "/var/log/hipache/access.log" ],
      "fields": { "type": "hipache" }
    }
  ]
}
Having data-only containers everywhere would be better :)
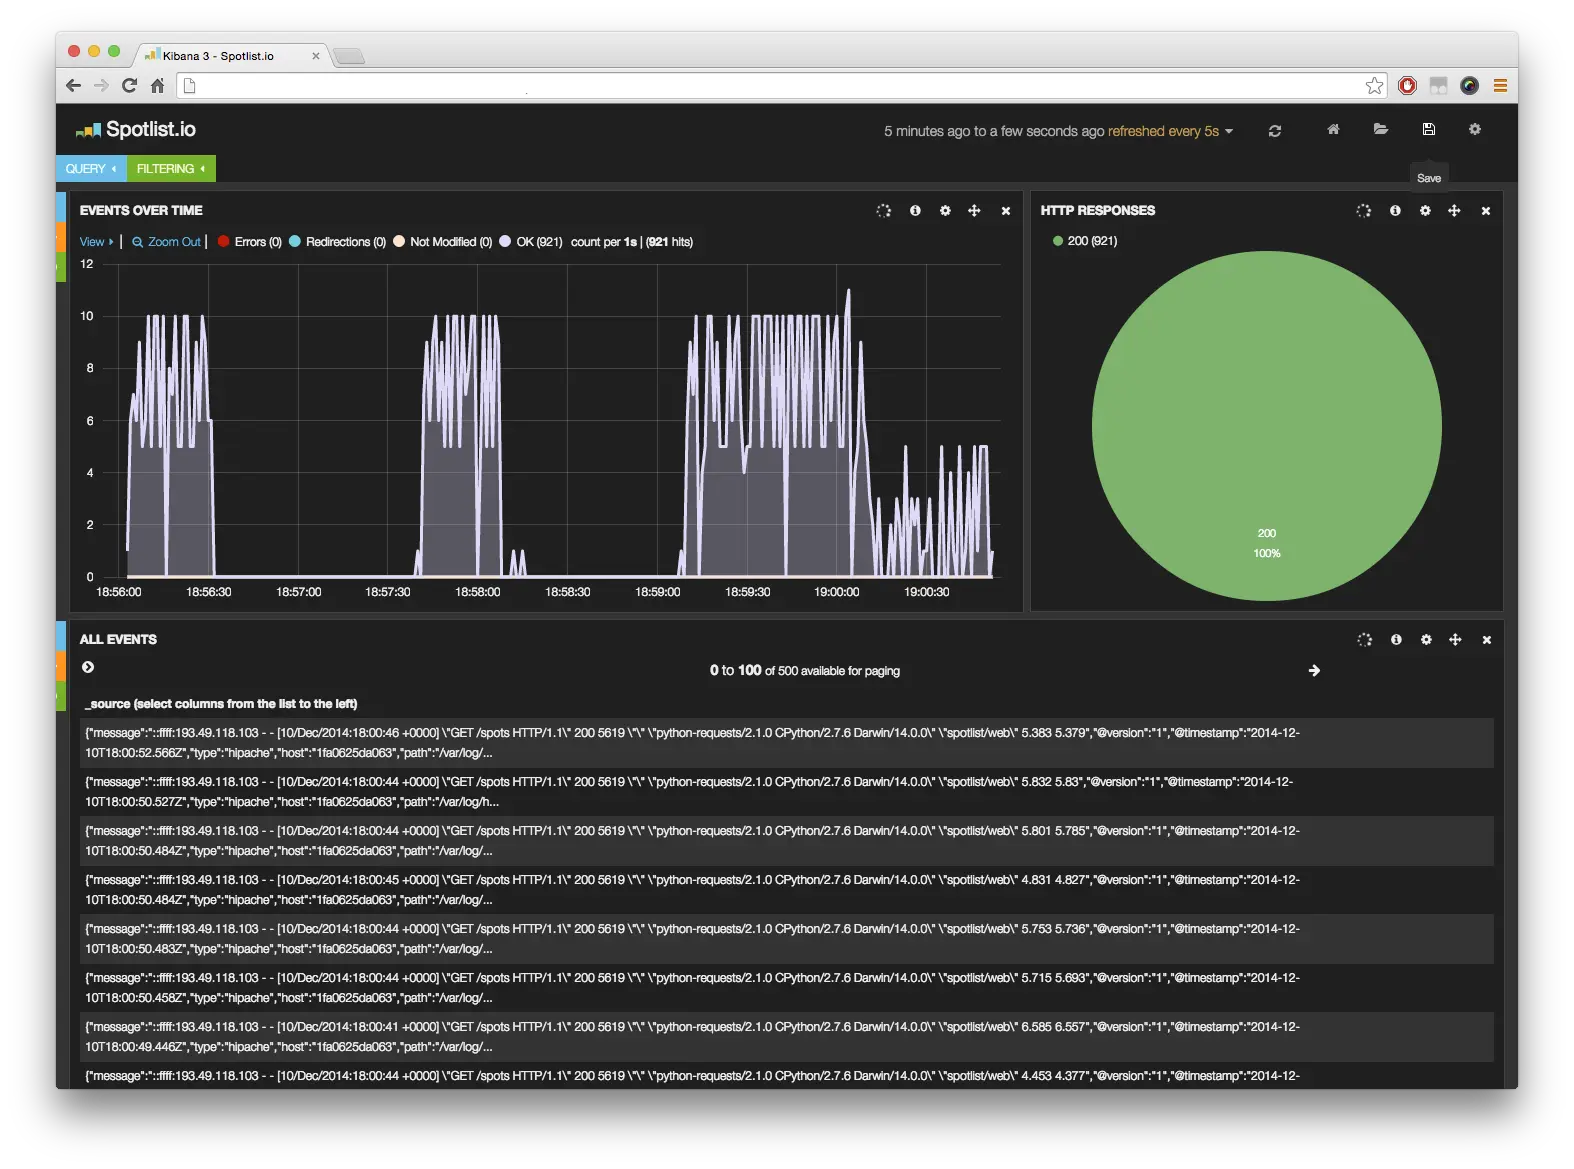
Kibana
This is the final piece! You can now create your own dashboards in Kibana. Here is mine to monitor the HTTP responses of the load balancer:
Need inspiration? Watch this video if you speak French.
Also…
Twelve Factors mentions that logs should be sent to
std[err|out], which does not always seem possible to me but, if you do that,
then you will probably be interested in logspout.
ℹ️ Feel free to fork and edit this post if you find a typo, thank you so much! This post is licensed under the Creative Commons Attribution-ShareAlike 4.0 International (CC BY-SA 4.0) license.